🔢 Research Paper Summary Generator: How It Works
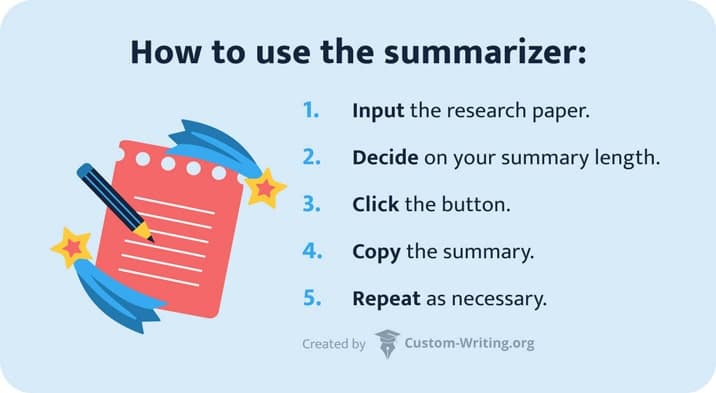
To summarize a research paper online using this instrument, you need to undertake 5 steps:
- Input the research paper into the textbox; it must be up to 17000 characters.
- Decide how long the summary will be.
- Click the button and wait for several seconds.
- Copy the summary and paste it into your word processor.
- Repeat as necessary.
🎁 Who Benefits Most from a Research Paper Summarizer?
Our online tool will help you quickly condense a scholarly paper into a concise synopsis. Here's who might benefit from using it.
- Students. Every college or university student has to scan and analyze numerous scholarly works to complete their assignments and assessments. Our research paper summarizer can automate this process, saving time and making it easier to manage extensive reading lists.
- Journalists and content writers. If you cover science issues in journalism, you know how challenging it can be to quickly grasp a new topic, identify the most relevant studies, and understand their key findings. Our tool helps you summarize research papers online, getting concise and reader-friendly passages that can be easily incorporated into your content.
- Professionals. To be successful in fields like law, medicine, programming, and many others, one has to stay updated with the latest research. Our research paper summary generator enables you to keep up with cutting-edge studies and maintain a high level of professional expertise.
So, this research paper summarizer is especially valuable when it comes to crafting a literature review. Being able to summarize scholarly sources, the tool still can’t organize them so that they would showcase the importance of your research problem. If you need support with that, you can always count on our literature review writing service. We assign the most experienced specialists with relevant degrees to advanced-level orders, ensuring outstanding results.
📝 3 Reasons to Use This Research Paper Summarizer
This AI-powered research paper summary generator will enhance your literature review preparation.

Here is what you can do using the free tool.
-
Enhance your understanding of a research paper.
Regardless of the topic, quality research papers are written according to certain rules. Formal language, scientific jargon, and complex structure make them challenging to grasp. The research paper summarizer by Custom Writing helps you quickly understand the key ideas of a work without missing essential details.
-
Quickly prepare literature reviews.
Crafting a well-written literature review implies scanning many works in a specific study field to find those suitable for inclusion. How can you quickly understand if a particular text is a good fit? What if reading an abstract is not enough? That’s where our research paper summary generator comes in. The tool helps you speed up the process to help you make informed decisions.
-
Simplify complex research papers.
Reading many complicated scholarly texts can be overwhelming. The process might drain you, leaving little energy for other academic tasks and social activities. Our online tool reduces your cognitive load by generating a summary of research paper online.
Updated: