Executive Summary
Wal-Mart Stores is a multinational company that operates retail stores in different set ups across the world. It operates more than 9667 retail units in 28 countries with an employment of 2.1 million associates. Wal-Mart is a leader in employment opportunities, corporate philanthropy as well as sustainability. Indeed, Fortune Magazine ranked it the most admired retail company in 2010 in the top ten (Wal-Mat Inc, 2011).
Segments and products and services
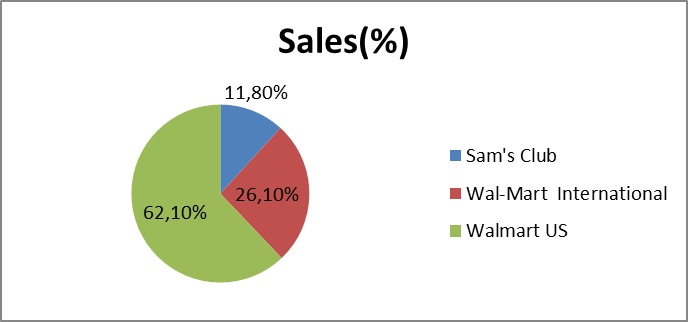
Wal-Mart Stores, Inc. particularly operates retail stores from different parts of the world. There are three segments under which it operates. These includes Sam’s Club, Wal-Mart International and Wal-Mart U.S. Wal-Mart US segment reported 62.1% of the company’s net sales in 2011 fiscal year. This segment operates retail stores in Puerto Rico United States. It also operates online retail stores-Wal-Mart.com. Wal-Mart international segment operates retail stores in 14 countries. The segment reported 26.1% of the company’s net sales during 2011 fiscal year. The international segment manages restaurants and retail stores. “Sam’s club segment is engaged in membership warehouse clubs which operates in Puerto Rico and United States.” (Wal-Mart Inc, 2011, p. 5). Sam’s club also operates an online retail store, Samsclub.com. 11.8% of the net sales during 2011 fiscal year were generated by this particular segment (Company Reports, 2011)
Industry
The company operates under a highly competitive sales environment. Discount retail industry under which Wal-Mart operates is very dynamic and occupies an enormous size in the economy. Competition is rife, especially in regards to the store size, location, price, merchandise mix, overall image, technology, innovation, layout and environment. Economy of scale is a typical strategy in this industry. To achieve high level of operational effectiveness, the leading retailers vertically amalgamate functions such as manufacturing, purchasing, shipping and advertising. Top competitors draw substantial competitive advantages from these functions. The main competitors include supermarkets, variety, specialty, drug, department, and discount stores. Most of the competitors are international, regional or national chains.
Since the company operates online stores, it also faces stiff competition from catalogue businesses, as well as internet-based retailers. Besides competing for sales, the company also competes for quality employees as well as site locations. Essentially, the players in this industry are influenced by factors such as deflation, fuel and energy prices, labor costs, customer preferences, consumer credit availability and fluctuations of currency exchange among many others. By 2001, Wal-Mart had been enjoying an impressive market share of 50 percent (Company Reports, 2011).
Wal-Mat’s major competitors include Kmar, Target, Beyond, Bath, Safeway and Circuit City and Bed. Many surveys have shown that Wal-Mart is preferred by many consumers compared to its competitors. Many of the audiences who have participated in these surveys claim that Wal-Mart is their preferred company because it offers a variety of products at low prices and at high quality. Wal-Mart’s primary competitor in warehouse segment is Costico, which achieves high level of sales but operates fewer warehouses. In respect to supermarket retailing, Wal-Mart competes with companies such as Safeway, Kroger and Albertson’s. Altogether, these competitors find it hard to outweigh Wal-Mart particularly due to its low prices (Company Reports, 2011).
Competitive advantage
Wal-Mat manages to remain competitive in the industry as a result of its powerful strategies which give it advantage over its competitors. One of those strategies is the distribution system. Wal-Mart maintains a strong electronic linkage of sales and inventories with all the distributors, something that the competitors find difficult to replicate. In addition, Wal-Mart has established a strong partnership relationship with suppliers. Wal-Mart is committed to keeping the relationships growing with time. Ideally, Wal-Mart competitors cannot match the long-term and established relationship that has evolved for many years. To further counter the competitors, Wal-Mart counts on its cost-saving capability to pay its suppliers (Barone & DeCarlo, 2003).
Wal-Mart has heavily invested in technology, hence building a substantial competitive edge. For example, the company uses advanced and effective IT system, thus staying ahead of its competitors. The systems are continuously upgraded to ensure effectiveness of the company operations. Wal-is also proud of its skillful and motivated work force. The company enjoys the best workers in the market, as a result of continuous support, training and motivation; hence enhancing productivity more than its competitors (Barone & DeCarlo, 2003).
Financial Condition of Wal-Mart and its Ability to Achieve the Strategic Objectives as Discussed in the Annual Report
Figure 4: key ratios.
Current ratio is the ability of the company to meet its short term debts. Wal-Mart registered a ratio of 0.9 which is slightly lower compared to the industry which reported 1.1. “The higher the ratio the more capable is the company in paying its obligations.” (Hillegeist et al., 2004, p. 23). A ratio which is below 1 suggests that the company could be experiencing problems paying short term debts. Particularly, this is not a very good sign and the management needs to put up strategies to minimize the short-term debts while at the same time increasing the short-term assets. Nonetheless, the low current ratio could be as a result of heavy inventory turnover which is a typical sales strategy for Wal-Mart.
Wal-Mart can use debt equity ratio to evaluate the amount of money it borrows safely at a particular period of time. The ratio which stands at 0.84 is higher compared with the industry at 0.74. Notably, this ratio impacts taxes, cash flows and earnings in different ways. The management of Wal-Mart would wish to ensure a good balance in order to realize utmost benefits. The manner in which the company’s’ money is invested particularly impact the debt/equity ratio. While borrowing money for investments, the management needs to consider the fact that such debt will attract interest which is deductable as business expenses.
The management should ensure that it builds a good credit rating (repaying the interest for the borrowed money on a timely basis) so as to attract and retain lenders. On the other hand, equity is the permanent ownership of the stake of the company. Considering that the debt/equity ratio for Wal-Mart is above the industry average, the management would want to assess whether they have invested too much in debt finance or not. If the company has no difficulties paying the interest rates for the borrowed money, then there is no cause of concern. The management should, however, invest those funds well to generate income for the company.
The leverage ratio for Wal-Mart is almost at par with the industry average. This ratio is instrumental in measuring the financial health of the company as it shows how much debt has been used on the balance sheet. Normally, more debts expose the company’s stock to more risk. In other words, equity investors will shy away from investing in the company because the debt holders usually enjoy the first claim to the company assets in the event that the company is liquidated. It is, therefore, very important for the management to maintain a proper mix. All in all, Wal-Mart’s ratio appears healthy.
Figure 5: Growth rates.
The percentage increase in sales during the financial year 2011 was 3.4% from 1.0% in 2010 financial year. The sales growth during 2011 fiscal year is primarily attributable to business expansion, as more retail stores were opened. In addition, volatility of currency exchange rate had substantial influence on sales growth. Apparently, the sales growth rate can be compared with the operating expense growth rate. The objective of the company is to maintain a higher sales growth rate, and a lower operating expenses growth rate. The significant increase in sales shows that the company has managed to achieve this goal.
Figure 6: Return on investment.
Return on investment (ROI) is a very good metric measure of how the company is effectively employing the assets of the investors to generate income. Strong ROI instills confidence in the investors that the company is actually employing the assets effectively. ROI remained relatively stable for 2010 and 2011 fiscal year, at 19.3% and 19.2% respectively.
Trend Analysis
Figure 7: Profitability trends.
Gross profit margin is a very good measure of profitability as it shows the revenue that is available to cover operating expenses among other expenses. There was a slight improvement from 2009 to 2010, after which it stabilized. This ratio gives an insight into the financial health of the company, though not a very reliable estimate of pricing strategy. Wal-Mart’s margin is somewhat adequate to cater for operating and other expenses (Company Reports, 2011). Although the fluctuation is not drastic, the management needs to device better strategies to ensure the ratio’s stability unless the industry is experiencing radical changes which could impact pricing policies or cost of goods.
Wal-Mart’s operating margin has been improving since 2009. The management can easily control the operating expenses compared to cost of sales. This makes it very critical for the investors to investigate operating profit margin. Indeed, positive or negative adjustment to this ratio is as a result of the management, and hence, Wal-Mart should try to paint a good picture to the users of financial reports through this particular ratio. In that respect, the management should maintain a positive improvement on its operating profit margin.
Net profit margin is another indicator of the company’s profitability, which is calculated by dividing net income by revenue. Similarly, this ratio has been improving gradually since 2009. This ratio is the most critical indicator of profitability. It is also extensively analyzed by investors, and its positive improvement is a positive indication on the part of the company. The management should not relent on its expense control measures in order to sustain improvement on this ratio.
Return on equity is “the amount of income returned as percentage of shareholders equity” (Finger, 1994, p. 6). This ratio shows the extent to which profits are generated from the capital invested by the shareholders. Return on equity is a strong indicator of the company’s earnings. It reveals to the investors how effective the management is employing their money for income generation. Wal-Mart’s ROI has been impressive, especially because it has maintained a steady improvement since 2008. The management should focus on returns improvement, generally, in order to improve return on investment. This is possible through effective investments.
Return on assets is an indicator of how the company has been effective in investing the assets to generate returns. Wal-Mart has remarkably maintained a stable improvement since 2008 financial year. The management should use this ratio while deciding on whether to invest in new projects or not. For example, the management should not invest in a project whose rate of return is less than 9.07% in 2011, which is the year’s return on investment. More effective investment strategies can be used to improve this ratio (Company Reports, 2011).
Wal-Mat Cash Position
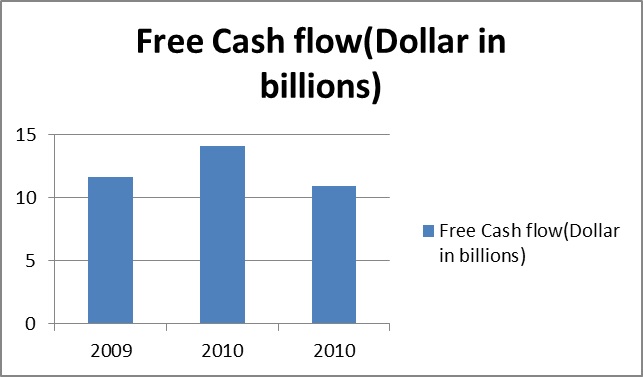
Figure 8: Wal-Mat cash flow trend.
According to the company report (2011, p. 56), free cash flow is the “net cash provided by operating activities in a period minus payments for property and equipment made in that period.” The company generated cash flows of $10.9 billion, $14.1 billion and $11.6 billion for 2011, 2010 and 2009 fiscal year respectively. Wal-Mat management uses free cash flow to measure the company’s financial performance. In particular, free cash flows are used to measure the extent to which Wal-Mart can generate cash from various business operations. The slight decline in free cash flow during 2011 financial year is attributable to inventory investment. Lower inventory levels and enhanced operating results were the reasons behind the cash flow increase in 2009 compared to the year 2010. All in all, the company has managed to maintain a positive cash flow, which is healthy and instrumental in attainment long-term growth (Finger, 1994).
Significant sources of cash flows have been generated from operating activities. Wal-Mart can supplement these cash flows with short-term borrowings and long-term debts to finance capital projects. Nonetheless, the use of such funds to finance capital project is somewhat limited as a substantial amount has to be set aside to finance divided on share repurchases or the company’s common stock (Finger, 1994).
Risk Level and Risk Tolerance
Wal-Mart being one of the largest retailers in the world is heavily affected by fluctuations of international exchange rates. Because of its strategy offering their customers quality merchandise at low prices, it is important to control its costs. This can be achieved through buying and selling goods in the international market.
Due to its presence in a number of foreign countries, Wall-Mart is vulnerable to foreign currency translation risk since it must translate the foreign currency into the US currency for reporting purposes. Foreign translation risk often affects the balance sheet items. For instance, “reporting the assets and liabilities of a foreign subsidiary are translated at current exchange rates, whereby related translation adjustments are recorded as a component of other accumulated comprehensive income” (Bartov, Bodnar & Kaul, 1996, p. 56).
In addition to income received from sales, Wall-Mart also obtains income from international suppliers, which include allowances provided by suppliers (to compensate the company for distributing their products through their distribution channels), discounts allowed for purchasing certain volumes of merchandise, reimbursements and promotional allowances among others. To manage these risks, Wall-Mart uses derivative financial instruments for hedging purposes. In addition, market risk stands for the likelihood that the instrument’s value will not remain stable (Bodnar, Hayt, Marston & Smithson, 1995).
In hedging, “change in the value of the derivative is mostly offset by change in value of the underlying hedged item.” (Phillips, 1995, p. 12). Credit risk is the possibility that the contract terms will not be observed by the other party. Credit risk is checked through controls such as checking set limits, credit ratings and collateral. In reference to various derivative agreements, the company held cash collateral of $344 million and $323 million in 2011 and 2010 respectively.
The company has a policy of recording cash collateral exclusive of any derivative asset. Any collateral recording is reflected in the company’s accrued liabilities as amounts due to the counterparties. More so, as a part of master netting arrangement with its counter parties, the company is required to record collateral if the derivative liability position exceeds $150 Million. In the event that the company provides cash collateral, it would be recorded as a receivable exclusive of any derivative liability.
Undertaking business transactions in local currencies and buying forward currency contracts is also used to reduce foreign transactions risk. A forward currency exchange contract mitigates exposure to translation risk on cross boarder trading (Choi & Prasad, 1995). These contracts are generally for six months or less. The company also uses debt swap to hedge its currency. In 2010 financial year, Wall-Mart entered into swaps to hedge against currency exchange rate fluctuation associated with expected repayment of non-US denominated debt.
The aggregate fair value of these swaps as on January 31, 2010 and 2011 reflected a gain of $471 and $475 million respectively. In addition to swaps, Wal-Mart also held a designated debt of about $3 billion on 31st January, 2011 as a hedge of the net investments in the UK. The company has been applying the necessary measures to reduce the impacts of foreign currency risks, though the risk is not fully eliminated (Lattman & Richardson, 2006).
Risk of Internal Control Environment
Basically, internal controls refers to “a process designed to provide reasonable assurance regarding to the reliability of financial reporting and the preparation of the financial statements for external reporting purposes in accordance with Generally Accepted Accounting Principles (GAAPs) ” (Company Reports, 2011, p. 56).
The management is mandated to evaluate the effectiveness of the company’s internal controls at any given time. In its assessment, the management made use of criteria set out by the Committee of Sponsoring Organizations (COSO). “The audit included understanding of the internal controls over financial reporting, assessing the risk that the material weaknesses exists, testing and evaluating the design and operating effectiveness of the internal controls based on the assessed risk” (Company Reports, 2011, p. 66).
In addition, practical assurance which transactions are recorded appropriately to facilitate preparation of financial statements is provided in accordance with GAAPs. The receipts and expenditures of the company are also made in agreement with the approval of the management. The auditors concluded that the company has all material respects, maintained effective internal controls over financial reporting based on the COSO criteria (Company Reports, 2011)
Wal-Mart’s Vulnerability for Unethical Behavior
Wal-Mart faces numerous controversies for unethical business practices. Some of these unethical business practices include labor union opposition, where employees are not allowed to join labor unions. They are instead compelled to report their grievances to the management. This policy does little in solving employees’ problems. It actually offers the company a leverage to stop unwanted complaints (Anell & Wilson, 2000).
What is more, employees are paid lower wages in comparison with their unionized counterparts. The organization is reported to have prohibited its employees to talk to labor officials, which is totally unethical. In addition, the employees have filed a complaint with National labor relations board, alleging that Wal-Mart violated federal labor law by bribing them to report co-workers who subscribed to any union (Memery, Megicks, & Williams, 2005)
Wal-Mart is continually accused of discriminating against women. Women have been left out of promotion and training opportunities. The employees have filed a sex discrimination lawsuit against the company. The suit was filed because the company provided unequal opportunities for women. Low wages is another issue facing Wall-Mart (Thompson, 1996). As a result, employees are forced to seek public intervention.
Basically, one of the reasons why Wall-Mart pays low wages is to cut on operating costs. Wal-Mart is indeed battling litigations in court for illegally transporting harmful chemicals. As such, the company is undergoing criminal investigations for violating water and hazardous material transportation, which can be viewed as unethical.
Effectiveness of the Company Inventory and Service Costing Methods
Wal-Mart values its inventory “at the lower of cost or market as determined primarily by the retail method of accounting, and using the last-in, first-out (LIFO) for virtually all its segment’s merchandise inventory” (Company Reports, 2011, p. 59). The management is required to make its own judgment while using the retail method. This can sometimes lead to lack of objectivity considerably affecting the value of gross profit and closing stock.
The company uses factors such as anticipated demand and customer preference to determine markdowns. On the other hand, it is probable that changes in customer preference and weather patterns might cause significant adjustments in the manner in which markdowns are measured. The company can, however, change the level at which retail method is used, whenever significant changes in the environment are deemed probable.
Prediction of the Company’s Financial Position in Five Years
The financial performance during 2011 fiscal year is solid and promising. Notably, the net sales have increased by 3.4 percent, while the operating income has increased by 6.4 percent, which is very impressive. Considering that the management is very committed to counteract the key financial obstacles, the growth rate is expected to continue in the next five years. The company’s diluted earnings per share increased by 12 percent per share, again adding more credence to our optimistic anticipation.
As a result, more investors might get attracted by the company’s shares, hence, improving the company’s share price for the next five years. Past analysis on the return on investment shows a stable value of over 19 percent, something that is not expected to turn around. Particularly, a stable return on investment will continue building confidence in the existing shareholders as well as future investors. Essentially, the company will establish a strong capital base, and capitalize on it by expanding the scale of operations.
In addition to this, the company is closing 2011 financial year with a cash flow of $11 billion, while the shareholders have been generously compensated by $19.2 billion through share repurchase and dividends. The result shows a strong foundation and commitment to compensate the shareholders, a momentum that is not likely to fade in the next five years. Above all, Wal-Mart’s competent and committed leadership team seems focused on financial priorities of growth, returns and leverage. We, therefore, expect the leadership to substantially lift the company’s financial performance for the next five year (Company Reports, 2011).
References
Anell, B.I. & Wilson, T.L. (2000). The flexible firm and the flexible co-worker. Journal of Workplace Learning Employee Counseling Today, 12, 165–170.
Barone, M.J. & DeCarlo T.E. (2003). Emerging Forms of Competitive Advantage: Implications for Agricultural Producers. Midwest Agribusiness Trade Research and Information Center Research.
Bartov, E., Bodnar G. M., & Kaul A. (1996). Exchange Rate Variability and the Riskiness of U.S. Multinational Firms: Evidence from the breakdown of the Bretton Woods System. Journal of Financial Economics, 42(1), 105-132.
Bodnar, G. M., Hayt G. S., Marston R. C., & Smithson C. W. (1995). Wharton Survey of Derivatives Usage by U.S. Non-Financial Firms. Financial Management, 24(2), 1-6.
Choi, J. J. & Prasad A. M. (1995). Exchange Risk Sensitivity and its Determinants: A Firm and Industry Analysis of U.S. Multinationals. Financial Management, 24(3), 77-88.
Company Reports. (2011). Wal-Mart Inc. Web.
Finger, C. (1994). The ability of earnings to predict earnings and cashflows. Journal of Accounting Research 32(2), 210-223.
Hillegeist, S., Keating E., Cram D., & Lundstedt K. (2004). Assessing the probability of bankruptcy. Review of Accounting Studies, 9, 5-34.
Lattman, P. & Richardson, K. (2006, August 29). Hedge funds play hardball with firms filing late financials. Wall Street Journal, p. A1.
Memery, J., Megicks, P., & Williams, J. (2005). Ethical and social responsibility issues in grocery shopping: a preliminary typology. Qualitative Market Research, 8, 399–412.
Phillips, A. L. (1995). 1995 Derivatives Practices and Instruments Survey. Financial Management, 24(2), 115-125.
Thompson, C. J. (1996). Caring consumers: gendered consumption meanings and the juggling lifestyle. Journal of Consumer Research, 22, 388–407.
Wal-Mart Inc. (2011). Walmat. Web.