Introduction
LabVIEW is software that was developed to design systems of measurement [1]. In addition, LabVIEW provides an array of tools for controlling the course of an experiment, such as specific methods of providing time constraints, etc. Thermocouples, in their turn, are typically defined as tools for measuring temperature [2].
Experimental Setup and Procedure
The experiment was carried out with the help of the LabVIEW software and a thermocouple. While the latter allowed for collecting the data concerning the temperature and its change, the former served as the tool for measuring the above-mentioned change.
As the test outcomes show, the tool in question allows for a very accurate measurement of changes in temperature. The data was acquired by measuring the temperature with the help of the thermocouple. The analysis of the information was carried out by defining the mean and the standard deviation of the data, as well as charting the trend line.
Results and Discussion
As the outcomes of the measurement process show, there is a direct correlation between temperature and time in each of the measurement sets delivered after the corresponding data was inserted into the LabVIEW fields. Particularly the correlation between time and temperature can be expressed with the help of the following linear formula: aaa.
It should be noted, though, that there are certain differences between the plots. Particularly, the fact that the patterns of temperature change are altered in the final chart deserves to be brought up. As Fig. 4 above shows, there have been no drastic shifts in temperature rates throughout the experiment except for the first few milliseconds. The given phenomenon stands in sharp contrast to the results delivered in the course of previous measurements, which provide a rather uneven distribution of temperature, especially at the beginning and the end of the test. The fact that the data is grouped in horizontal lines shows that the temperature rates are recurrent. In other words, the temperature drops and rises at specifics points in time, therefore, leading to the aforementioned phenomenon. Moreover, the gaps in the data should be mentioned as the key characteristics of the diagrams. The phenomenon under analysis can be explained by the fact that the loops in data occur during a millisecond (i.e., the millisecond multiple).
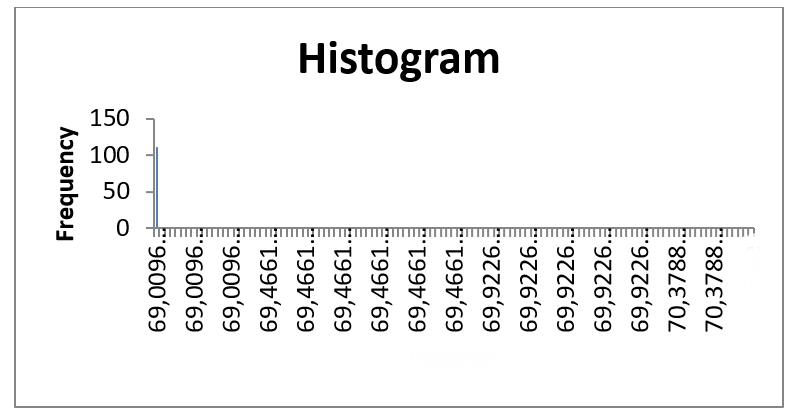
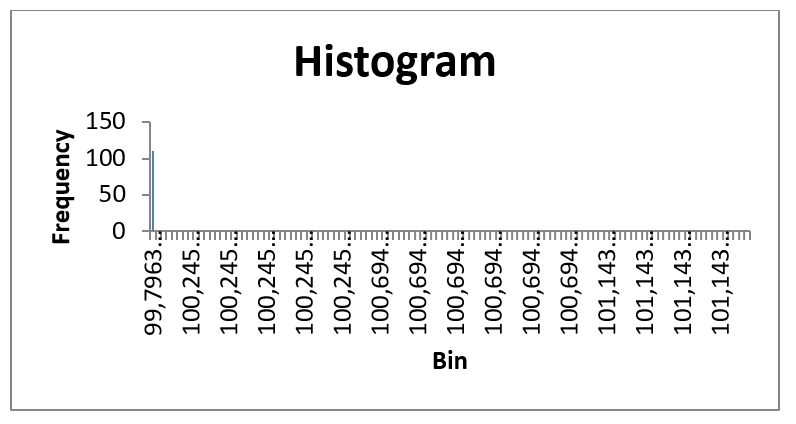

A closer look at the histograms will show that the distribution cannot be deemed as normal, as most data has a zero frequency, whereas the data provided in the first input has the highest frequency rates. Based on the standard deviation and mean for each data sets provided below, a change in the millisecond multiple and the sampling data rate allows for a more detailed (in case the millisecond multiple and the data rate are increased) or, on the contrary, a more generalized outcome. As far as the perfect sampling rate is concerned, a rate of 48 kHz seems reasonable [3].
Conclusion
The experiment has shown that the LabVIEW can be considered an appropriate tool for data measurement. Additionally, the use of thermocouples should be considered when utilizing LabVIEW. The loops in the temperature scatter plot are a graphic evidence of recurrent data. While the tool triggers rather high approximation rates, it still works outstandingly as the means of measuring data.
Reference List
- Bress, T., Effective LabVIEW Programming, Wiley, New York, new York City. Web.
- Kroos, K. & Potter, M., Thermodynamics for Engineers, Cengage Learning, Boston, Massachusetts. Web.